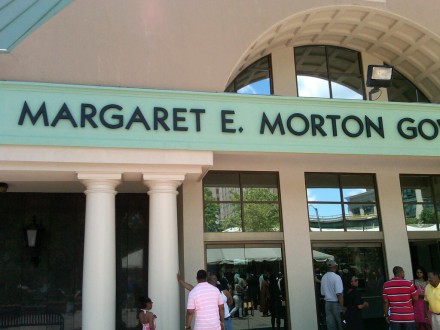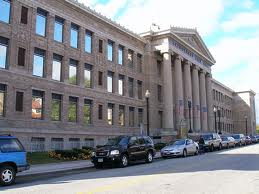
When you’re trying to close a budget gap, just about everything is on the table. Even selling the City Hall annex also known as the Margaret Morton Government Center, 999 Broad Street, named for the former state senator and community leader. See valuation information here.
City officials say they will entertain offers to sell the annex, also a former bank building, that was purchased by the city in 1998 during Joe Ganim’s first tenure as mayor. Ganim spent about $3 million renovating the building and relocated some administrative offices to the annex in 2000. The annex houses the mayor’s office, chief administrative office, economic development, city attorney staff, registrar of voters, probate court and a few other departments. The Board of Education, town clerk, city clerk, tax collector, tax assessor and labor relations are among the offices working out of City Hall on Lyon Terrace where the City Council conducts meetings.

What could the annex fetch?
In 2011 then-Mayor Bill Finch had considered a sale/lease back of the two buildings that he hoped secured about $30 million. The arrangement never materialized.
The current scenario under consideration is selling the annex and relocating the existing offices back into Lyon Terrace that had functioned as a high school prior to becoming City Hall in the late 1960s. Wouldn’t it be a tight fit for all the departments back in Lyon Terrace?
“We were able to do it before, why not again,” said one city official. If need be the city could renovate Lyon Terrace to accommodate the extra departments.
The city has not yet structured a formal process to market the building, but it’s under consideration.


Paging Troll Real Estate!
I can’t wait to see what they are going to do with the City Attorney, Registrars of Voters, Vital Statistics and Probate Court, none of which were in City Hall.
Please sell it! I was only in the Annex once before Joe came back and I can’t believe what a waste of space it is. Offices all over the place, some not used, you need a GPS to find where you want to go. There’s an oversized area intended for Council members to use, can’t figure out why those offices are taking up space. Some council members work during the day, and in general what do they have to work on? I’m sure leasing outside space would be far less expensive than keeping that white elephant. We went that route before the Annex and it worked just fine.
You could race motorized go-carts through those hallways in a Le Mans style Grand Prix.
Remember, Lisa. We used to call it the White City Hall because it was such a White Elephant although some people took to calling it that because it was all the white-collar jobs, the white employees and the white (executive) visitors going into the building.
If memory serves me correctly, the $3 million in demo and build-out was awarded through no-bid contracts to reward politically connected contractors.
It was sold to the council as a temporary fix, since the building was nearly vacant and Chase was threatening to move out and we couldn’t have a vacant building that large in the middle of downtown.
So the city bought it, refitted it and told the council the lease from Chase would pay for most of the cost. Chase kept cutting back on space until there was a small branch and then Chase moved out completely leaving the city without a paying tenant.
Since then it pretty much serves as a sponge. Soaking up uses to justify its existence.
Selling it would be a great idea, but who will buy it? A politically connected individual who will buy dirt cheap and sit on it waiting for the revival?
And for how much? My guess is not much at all.
And to think the city went through the big ceremony of renaming it the Margaret E Morton Government Center just a few years ago now to put it on the market.
What an insult to a remarkable woman!
As I recall, Finch was up to no good with his plan. We wanted someone to build a new building the city would lease for 20 years.
It would add to the grand list, create tax revenues (which the city would be actually paying), reward a politically connected individual, somehow use city bonding money to keep the cost down and when the 20 years were up and we realized we were in such a bad position, Finch would be gone.
Well at least he had the part of Finch being gone right.
Collateralizing city assets to create short-term cash flow was an idea that has seen its better days. Just like borrowing to fully fund a pension plan and then losing half the money you borrowed due to bad investments.
There are no short-term quick fixes to the city’s financial problems and the council should be aware of this fact. If anyone tries to sell you such a solution, simply tell them Thanks but no thanks.
Just sent the 999 Broad Street profile on Vision Governmental Solutions to Lennie. It shows a drop of value in our “vital downtown” area for the 2.5 acres occupied by the Annex of about $100,000 per acre from nearly $750K per acre to nearly $650 per acre per the new valuation.
Can anyone see why I am asking the City assessor’s office to provide the total of new valuations and assessments on property includable in the Net Taxable Grand List as of last week? So what if we have a new and certified list as of March 1, 2016 after adjustments. What does such a list look like today? How much value has our Taxable Grand List lost since the last valuation? Time will tell.
What about the statue of Lewis Howard Latimer by Susan Clinard that stands in front of the Annex? It celebrates a famous American inventor who had connections to the City of Bridgeport and was an African American of some fame.
The statue has value to all Bridgeporters as an example of someone who used his many talents for the benefit of many. If this property were sold, where would this unique memorial be moved, or would it be sold as part of the property? Do we have a listing of such public art and memorials in the City? Who maintains the sites and where is the expense, if any, born by the City? By what process was this commissioned and paid for? Time will tell.
Great, who in hell is going to buy/lease that building??? Businesses are moving out of Bpt, not in. How about we sell Beardsley park? Oh never mind, that was sold the last time we had a deficit we had to make up.
I can remember back in the Fabrizi years, my council partner and I hung a sign on the fence outside the annex proclaiming:
FOR SALE BY OWNER
THE BELEAGUERED TAXPAYERS OF THE CITY OF BRIDGEPORT
Call 576-7201 to inquire.
The sign hung for weeks if not a month before someone finally took it down.
I think the fact it stayed up there so long was emblematic of how infrequently people walked out of the annex. It was drive in and drive home.
*** Sell that building and the McLevy Hall building as well, no? ***
Can this be Bridgeport’s short-term solution?
Of America’s most populous cities, the following impose the highest combined state and local sales tax rates:
1. Seattle, WA – 9.6%
2. Oakland, CA – 9.5%
3. Chicago, IL – 9.25% (10.25% as of Jan. 1, 2016)
4. Memphis, TN – 9.25%
5. Nashville, TN – 9.25%
6. Los Angeles, CA – 9.0%
7. Long Beach, CA – 9.0%
8. New Orleans, LA – 9.0%
9. New York, NY – 8.88%
10. San Jose, CA – 8.75% (tie)
10. San Francisco, CA – 8.75% (tie)
And here are the sales tax rates in the top 50 cities, ordered by population. Ranks are for these cities only:
How about selling Seaside Park? Or maybe we should save that for the next admin to sell to make up a deficit from this one.
Harvey,
Nice thought, but will the potential buyers want the property to be remedied to be valuable after rising tides and severe storms? When you sell off everything, finally, there is an end to that tactic. Let’s see how this budget season creates a real community dialog about what is important and what we will pay for with property taxes. Let the public participate much more fully and be welcomed than in recent years? Time will tell.
Veterans Park on Park Ave can be sold, Sacred Heart would love to have it. While we are at it, how about the golf course? I know Bpt can get a pretty penny for that. Sell! Sell! Sell!
Any money the City gets from the sale of parkland is required to be used on the parks.
But Phil,
That did not happen with the Solar Panel parcel. That was a capital lease and the proceeds were not required to go to the operating expenses of the parks.
So instead of selling, you do a 100-year land lease. Very common in Great Britain.
Bob, that would be an interesting legal and accounting question. Not clear-cut either way.
*** Maybe the city can go into the city building leasing business if they can’t sell it, no? ***
Mojo,
An interesting idea. There is a gymnasium of sorts in the Morton center at this time. How much per half hour to use? Free? To whom?
Isn’t the City in the leasing or quasi-leasing business already with the Arena, parking lots, Captain’s Cove and Airport operations, to mention a few? How are the funds coming into the City on those agreements? Who monitors them? What line of the Monthly Financial REVENUE Report will each be recorded on for Budget and Appropriations to monitor? Webster is behind for five years it was reported!!! Is that true? How could that be if someone is monitoring it? In this City when taxes or WPCA fees are not paid within much shorter periods of time, the properties get a full LEGAL TREATMENT and are sold off to raise funds for the CITY. Who is responsible? Where is the buck supposed to STOP? It’s REVENUE time, isn’t it? Time will tell.
So the Finch Administration created yet another vacant building Downtown when they spent a fortune to empty McLevy Hall of all its City operations, followed by a sham artist project they vacated. The building is now EMPTY! Just what we need: ANOTHER VACANT CITY-OWNED BUILDING DOWNTOWN! WHAT IS GOING ON WITH THIS BUILDING, DAVID KOORIS? Is anybody noticing these little things?
Bob Halstead,
Don’t go picking on David Kooris.
The business community likes him.
And Steve Auerbach likes him. Stevie A went begging for a job from him. And in another change from the campaign trail, apparently Joey G likes him.
So what’s not to like?